MercoPress. South Atlantic News Agency


Antarctica sea ice thicker than anticipated reveals an autonomous sub
 SeaBed was released in the Antarctic spring seasons of 2010 and 2012 to sample ice thickness in six locations that included the Bellingshausen and Weddell seas (Pic BAS)
 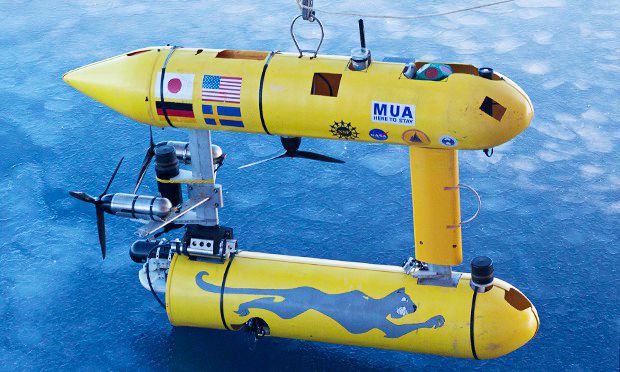 The AUV, SeaBED, was developed at the Woods Hole Oceanographic Institution (WHOI) in the US. It is about 2m in length and weighs nearly 200kg
 A novel autonomous sub has acquired the first detailed, high-resolution 3D maps of Antarctic sea ice. Released from a ship, the vehicle crisscrossed the underside of the floes, using upward-looking sonar to measure their shape.
The researchers involved in the project told the journal Nature Geoscience that the thickness of the pack ice was greater than they had anticipated. But they also caution against making generalizations from limited sampling.
Antarctic sea ice at its peak extent can cover 20 million square km; the research team on the other hand looked at just six small boxes some 500m along the square.
Nonetheless, the UK/US/Australia group got its proof-of-principle Autonomous Underwater Vehicle (AUV) into previously hard-to-reach places.
The hope is that this early demonstration will lead in the future to more effective means of assessing the volume of marine ice circling the White Continent.
This topic has become one of the most interesting questions in climate science in recent years as its trend line grows in the face of a warming planet.
Deep-winter sea ice in Antarctica now stands at an all-time high, as measured in the modern satellite record - and researchers are trying to work out why it has not followed the sharp decline seen in the Arctic.
“Antarctic sea has been kind of the poor sister,” says Jeremy Wilkinson from the British Antarctic Survey. “A lot of effort has gone into measuring Arctic sea ice, and we're only now just scratching the surface of Antarctic sea ice, especially in respect to thickness”.
“We want to understand how it is changing and how that integrates with climate and ecosystem changes.
”It's only by bringing all the processes together that we will be able to model them and say what's going on in the Antarctic
The AUV, known as SeaBED, was developed at the Woods Hole Oceanographic Institution (WHOI) in the US. It is about 2m in length, weighs nearly 200kg, and sports a twin-hull design that gives it enhanced stability.
SeaBed was released in the Antarctic spring seasons of 2010 and 2012 to sample ice thickness in six locations that included the Bellingshausen and Weddell seas, to the west of the continent, and off Wilkes Land, to the east.
The sub autonomously went about its business, tracking a “lawnmower pattern” under the ice for several hours before returning to the launch ship for recovery.
“Here's the hard part: the ice floes that we want to map are all moving,” explains WHOI's Hanumant Singh.
“What you do is place transponders in the ice so that the sub can move relative to those and produce a map that is consistent.
”The other big problem is that the ice will close up. In the six to eight hours that it takes to do one of these missions, the ice conditions change dramatically, and the hole you dropped the AUV in may have gone by the time the survey's finished.
“You then just have to hope that a new hole has opened up next to your ship, which has itself by then also moved.”
The researchers found that, on average, the thickness of the ice beneath sea level was 1.4 to 5.5m, with the thickest sea ice measured at 16m. They also encountered a lot of highly deformed ice, where one block had ridden over another, increasing the overall draft.

Top Comments
Disclaimer & comment rules-

-

-

Read all comments“the sharp decline seen in the Arctic.”
Nov 27th, 2014 - 09:21 am 0This is a false picture of the Arctic, because it applies only to satellite measurements from 1979. Prior to that there was a period of exceptionally extensive ice in the 60's and 70's. In the early part of last century, there was far more open water than now and Amundsen negoiated the NW passage in 1906.
Of course that doesn't fit the global warming narrative so they don't talk about it.
I would have thought the thickness would have been self evident...what is it? 10% above...90% below or something like that....
Nov 27th, 2014 - 10:24 am 0Just wait until KFC and her cronies find that this submersible is really a nuclear penguin mother ship...
Depends on a number of variables: the salinity of the water and the ice, the ambient temperature (to a degree), the shape of the ice and so forth, but the 90/10 split holds up reasonably well. However knowing that it holds up reasonably well isn't as good as actually measuring it.
Nov 27th, 2014 - 11:12 am 0I for one am expecting KFC and her band of merry halfwits to accuse the UK of autonomously submarinizing the South Atlantic. It's obviously not a cunningly disguised British spy vessel - they're painted red (it's traditionally the air-sea rescue Attack Helicopters that are yellow).
Commenting for this story is now closed.
If you have a Facebook account, become a fan and comment on our Facebook Page!