MercoPress. South Atlantic News Agency
Global temperatures are 1.02C above 1850/1900 average, and climbing, warns UK Met Office
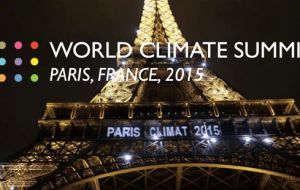
 The new data is certain to add urgency to political negotiations in Paris later this month aimed at securing a new global climate treaty.
  If temperatures remain as predicted, the world would then be half way towards 2C, the gateway to dangerous warming.
  To get over this problem, the Met Office use an average of the temperatures recorded between 1850 and 1900
  “This is the first time we're set to reach the 1C marker”, it is human influence driving “our modern climate into unchartered territory”, said Prof Belcher
 Global temperatures are set to rise more than one degree above pre-industrial levels according to the UK's Met Office. Figures from January to September this year are already 1.02C above the average between 1850 and 1900.
If temperatures remain as predicted, 2015 will be the first year to breach this key threshold. The world would then be half way towards 2C, the gateway to dangerous warming.
The new data is certain to add urgency to political negotiations in Paris later this month aimed at securing a new global climate treaty.
For researchers, confusion about the true level of temperatures in the 1750s, when the industrial revolution began and fossil fuels became widely used, means that an accurate assessment of the amount the world has warmed since then is very difficult.
To get over this problem, the Met Office use an average of the temperatures recorded between 1850 and 1900, which they argue makes their analysis more accurate.
“This is the first time we're set to reach the 1C marker and it's clear that it is human influence driving our modern climate into unchartered territory, said Prof Stephen Belcher, from the Met Office
Their latest temperature information comes from a dataset jointly run by the Met Office and the Climatic Research Unit at the University of East Anglia.
The HadCRUT database showed that in the first nine months of this year, the global mean temperature had just gone above 1C, hitting 1.02 with a error factor of plus or minus 0.11C.
Scientists say that the one degree mark will be broken in 2015 because of a combination of carbon emissions and the impact of the El Niño weather phenomenon.
”We have seen a strong El Niño develop in the Tropical Pacific this year and that will have had some impact on this year's global temperature,“ said Stephen Belcher, director of the Met Office Hadley Centre.
”We've had similar natural events in the past, yet this is the first time we're set to reach the 1C marker and it's clear that it is human influence driving our modern climate into uncharted territory.”
2013, the Intergovernmental Panel on Climate Change reported that the combined land and ocean temperature showed warming of 0.85C between 1880 and 2012.
They also noted that the difference in the average temperatures from the 1850 to 1900 period was 0.78C when compared to the average between 2003 and 2012.


Top Comments
Disclaimer & comment rules-

-

-

Read all commentsUK Met Office, the biggest fraudsters imaginable with 'Climate Change / Global Warming / whatever next'.
Nov 10th, 2015 - 11:02 am 0The problem is all the deadheads who do not understand basic measurement errors. Does anybody think the temperature measurement of today is stuck in the 1750's, no, of course not.
It's a tax revenue scam as far as governments are concerned.
From the NASA Website discussion of the Sunspot Cycle:
Nov 10th, 2015 - 02:38 pm 0“During the coldest part of the Little Ice Age, from 1645 to 1715, there is believed to have been a decrease in the total energy output from the Sun, as indicated by little or no sunspot activity. Known as the Maunder Minimum, astronomers of the time observed only about 50 sunspots for a 30-year period as opposed to a more typical 40-50,000 spots. The Sun normally shows signs of variability, such as its eleven-year sunspot cycle. Within that time, it goes from a minimum to a maximum period of activity represented by a peak in sunspots and flare activity.
”Beginning in 1611, Galileo Galilei made drawings of lower sunspot activity before the Maunder Minimum. Records of sunspot activity during the Minimum from other astronomers confirm the lower number of sunspots over the 70-year event.
“During those periods of low solar activity, levels of the Sun's ultraviolet radiation decrease, and can significantly impact ozone formation in the stratosphere. ”The changes in ozone that we modeled were key in producing the enhanced response,“ Shindell said. ”The changes in the upper atmosphere then feed down to the surface climate.“
”Between the mid-1600s and the early 1700s the Earth's surface temperatures in the Northern Hemisphere appear to have been at or near their lowest values of the last millennium. European winter temperatures over that time period were reduced by 1.8 to 2.7 degrees Fahrenheit (1-1.5 Celsius). This cool down is evident through derived temperature readings from tree rings and ice cores, and in historical temperature records, as gathered by the University of Massachusetts-Amherst and the University of Virginia.”
What we read and hear so often from the media is a discussion of weather, not climate. Weather happens over the course of a hundred years or so, climate happens over periods of hundreds and thousands of years. Don't be fooled by the media and the scientists that are benefiting from the fear.
They are not “predicting” anything here, they are simply reporting what they are measuring.
Nov 10th, 2015 - 03:54 pm 0Compared to values from 1850 – 1900, when the measurement methods used, although not nearly as accurate as today, were more than accurate enough for this comparison.
The question is how significant is the increase in terms of its effects and as an indicator of future trends.
The effects we are now seeing almost daily somewhere or other, as for the trend, the graph is only going one way, up.
Commenting for this story is now closed.
If you have a Facebook account, become a fan and comment on our Facebook Page!