MercoPress. South Atlantic News Agency


Visualizing Crop Health: How Data Drives Smarter Farming Decisions
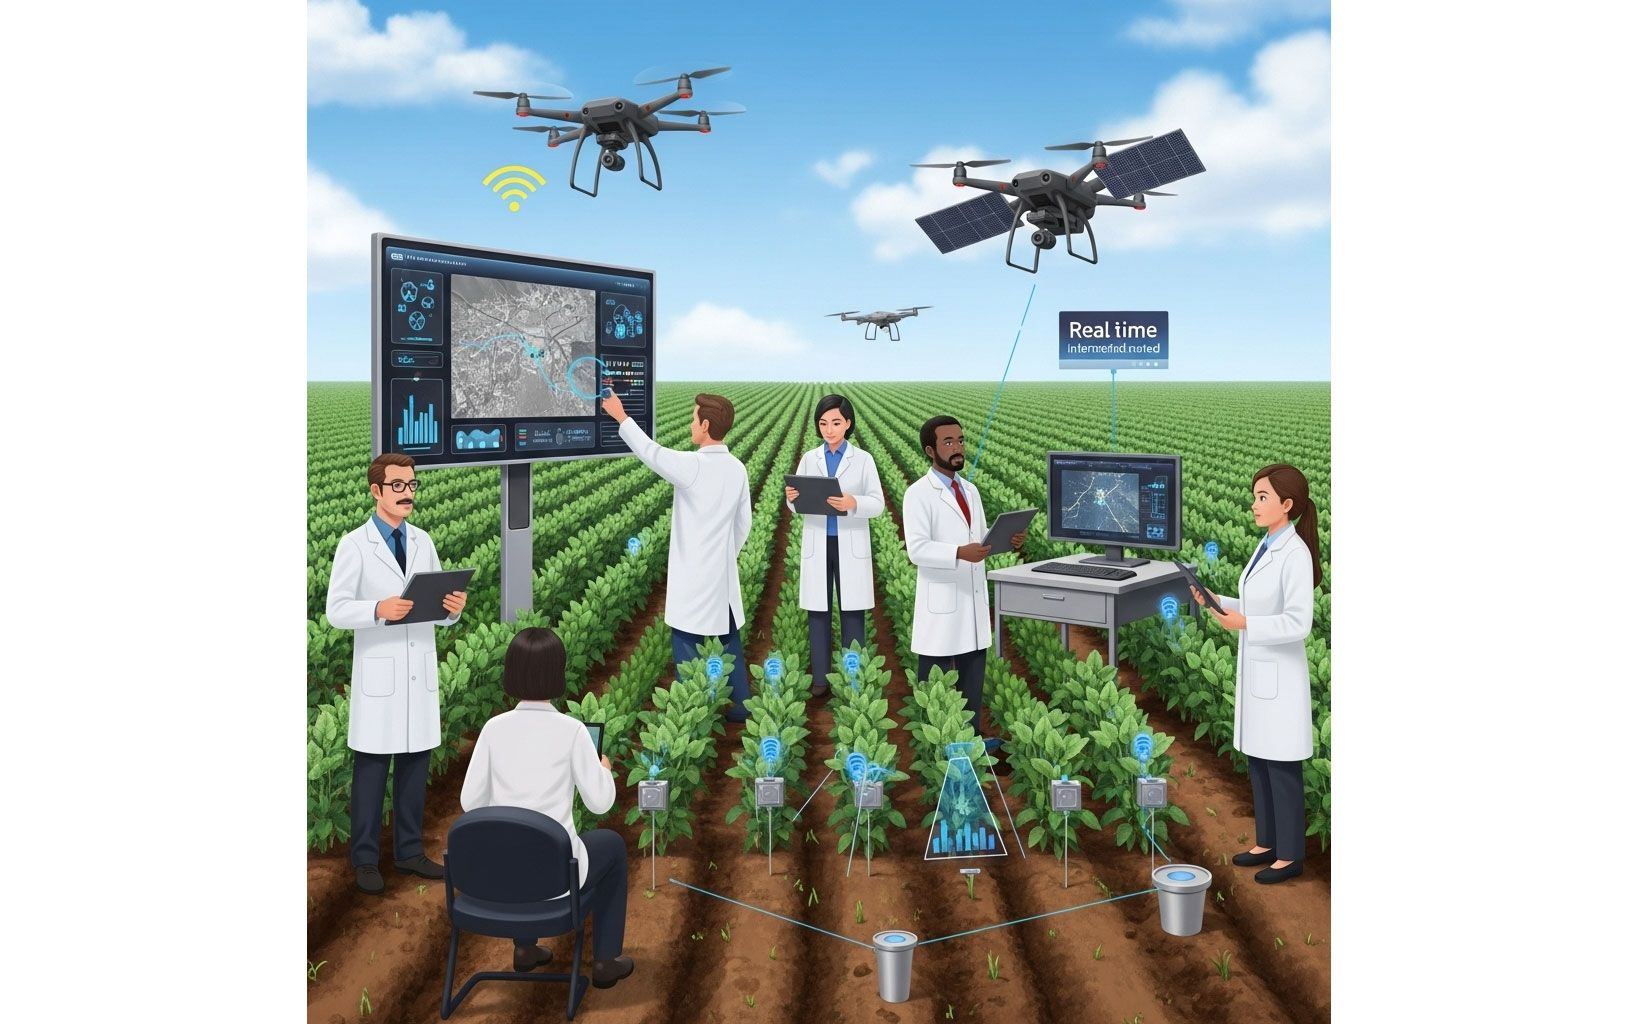
Worrying about crops is the inherent instinct of every farmer, especially those who depend on the health of their vegetation to make a living. Fortunately, the days when people had to rely on the weather, personal experience, luck, and prayers alone have passed; today, satellites, AI analytics, and Application Programming Interface (API) help farmers visualize their crop health down to the smallest detail and make informed, cost-saving decisions.
The Role of Agricultural API in Farming
API is a bridge that connects all kinds of software and the end-user. It receives, processes, and shares valuable information collected from numerous sources: by getting agricultural data via API systems, farmers can track changes in soil, weather, plant health, and across many other indices. Let’s consider the most relevant sources of information that can drive smarter farming decisions.
- Satellites. Remote sensing satellites capture images that can be processed through specific vegetation indices, revealing what plants are healthy and which need help.
- Soil moisture detectors. Special AI detectors can tell you when your soil is over- or under-watered; they adjust their recommendations based on how much moisture a specific plant needs versus how much it actually receives.
- Agriculture weather API. A weather API agriculture system can supply you with 14-day weather forecasts based on your region; it can also make suggestions after analyzing historical, location-specific weather data.
- Farm management systems. Other tools can deliver information about pests, plant diseases, crop nutrient levels, etc.
Instead of using these tools separately, farmers can simply rely on one integrated ecosystem that the agriculture API provides. They will receive combined, clear data that will reveal what crop health issues they should fix, how to adjust their irrigation systems, which locations have pests, and how to optimize their fertilizer management.
Why Crop Health Visualization Is Crucial
Another huge benefit of the agriculture data API is that it enables visualization. Think about it: satellites often store data in complex formats that are difficult to access. Both soil sensors and nutrient levels software provide information in the form of numerical streams. Are you ready to download and interpret each of these coded reports manually?
Most farmers are not, which is why they are increasingly relying on API. API passes all the data it collects to special visualization tools, and they, in turn, create maps, graphs, and images. Here is why this type of visualization is crucial for crop health:
- Color-coded maps help farmers detect the deteriorating state of their specific plants with no effort.
- Seeing satellite images allows spotting pests and problematic areas before the danger reaches unmanageable levels.
- Endless rows of data converted into simple graphs help farmers determine how much water and nutrients their vegetation receives in seconds.
A color-coded map will clearly show you which plants are healthy (they’ll be green), which are suffering (they’ll be yellow), and which require immediate attention (they’ll be red). As a contrast, without this kind of visualization, a farmer would have to spend hours, days, or even weeks trying to see patterns in the endless sea of data — and that’s provided that they understand the meaning of each number.
One other key benefit of visualization in farming is predictive decision-making. Research indicates that something as simple as a site-specific irrigation system installed in the problematic area can achieve water saving by 26%. So, if visual data reveals that 10% of your field is starting to experience insufficient moisture, you can intervene right away, before the problems actually begin.
However, you need to remember that visualization is relevant only when your platforms receive accurate and timely agricultural data. That’s why API should become an inherent part of your farming.
API in agriculture gives farmers a chance to spot trouble in real time. As we already established, if you were to use satellite images for analysis, it would likely take you weeks to analyze and comprehend everything. With API, you can do it instantly, as the data is constantly updated, and once it’s processed, it is presented in a clear and easily understandable visual format.
Use Smart Data to Make Your Crops Yield Profit
The market size of agriculture software-as-a-service is predicted to exceed 2 billion dollars in 2027; in turn, equipment-as-a-service will reach only 1 billion. These numbers show that an increasing number of farmers rely on software solutions to protect their crops.
The problem lies in figuring out which of the modern tools you actually need. You can choose one of many API agricultural products and try it out, and then, if you’re pleased with its work, you can explore the remaining systems. The choice is vast, and there is an answer to every single problem you might have. Keep up with the farming tech changes, embrace visualization, and enjoy healthy and profitable crops all year long.

Top Comments
Disclaimer & comment rulesCommenting for this story is now closed.
If you have a Facebook account, become a fan and comment on our Facebook Page!