MercoPress. South Atlantic News Agency



S&P 500 Price Prediction: What Macro Signals Say About the Index in 2026
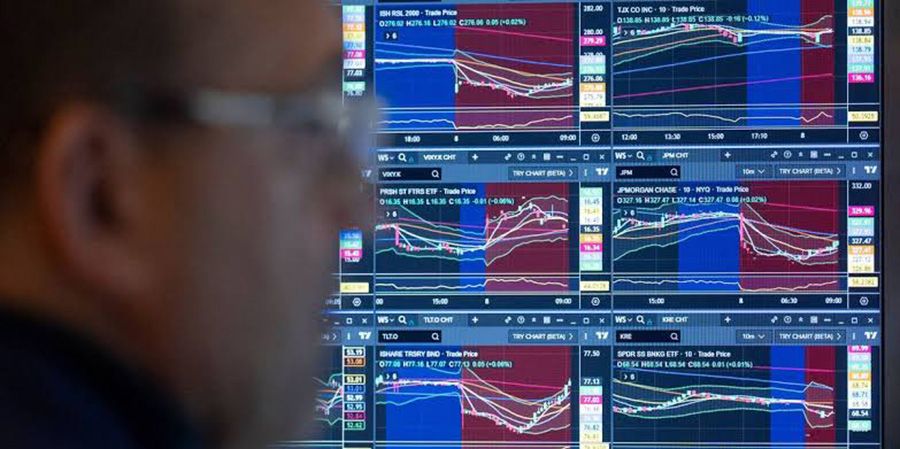
The S&P 500 set a record of 7,816.70 on August 13, 2026, then pulled back approximately 2% over the following two weeks as the 30-year Treasury yield touched 5.337%, its highest level in nearly two decades.
That sequence of events, a new all-time high followed immediately by a bond-market-driven pullback, captures everything essential about the S&P 500 price prediction debate in the second half of 2026. The earnings engine is running at its fastest pace since 2021. The cost of money is running at its highest since before the financial crisis. Both statements are true simultaneously, and the index level at any given moment reflects the market's current answer to which force is winning.
The Earnings Engine: What Is Actually Driving the Index
FactSet's blended second-quarter 2026 earnings growth figure of 50.4% is the strongest since the post-pandemic rebound. That number requires context before it can be used as an investment signal. Much of the growth reflects the comparison effect from a weaker 2025 earnings period, artificial intelligence infrastructure investment flowing through revenue before the associated depreciation charges arrive in full, and the concentration of the index in a small number of technology companies whose earnings have expanded disproportionately.
The concentration point is material. The ten largest index constituents account for approximately 39% of total market capitalisation. The seven largest technology names account for roughly a third. When a handful of stocks carry that much weight, the index's aggregate earnings growth reflects their specific dynamics rather than a broad improvement in US corporate profitability. Analysts' full-year 2026 estimate of 30% earnings growth and 2027 estimate of 13.6% are derived largely from continued strength in those same companies.
Capital expenditure across the index grew approximately 32% year-over-year in the first quarter of 2026, the fastest since 2007. The five largest cloud operators are spending on AI infrastructure at a rate materially above what they are booking in depreciation. This means the current earnings figures are flattered by deferred costs that eventually must be recognised. The 2027 earnings estimate is where that reckoning first becomes visible, which is why strategists who focus on the earnings path beyond 2026 are more cautious than those anchored to the current year's extraordinary growth rate.
The Valuation Tension: Two Numbers, Two Conclusions
The S&P 500's valuation situation is genuinely contradictory depending on which measure is used, and the contradiction is not resolvable by simply picking the measure that supports a predetermined conclusion.
The forward 12-month price-to-earnings ratio stands at 20.0, fractionally above its five-year average of 19.9 and one point above its ten-year average of 19.0. On this measure, the index looks approximately fairly valued. An investor looking at the forward P/E and concluding the market is not stretched is reading a factually accurate number.
The cyclically adjusted price-to-earnings ratio, which divides the index by a ten-year average of inflation-adjusted earnings to smooth out cyclical fluctuations, sits near 41.6. That is within a few points of its all-time record, last approached in late 1999 before the dot-com unwinding. An investor looking at the CAPE and concluding the market is historically expensive is also reading a factually accurate number.
The two measures disagree because current earnings are extraordinarily high relative to the decade-long average. Forward earnings, which are at four-year highs, make the denominator of the P/E large, compressing the ratio. Historical average earnings, smoothed over ten years, use a denominator that includes weaker profit periods, which makes the ratio larger. Neither measure is wrong; they are measuring different things. The CAPE's historical usefulness is as a long-run return predictor: high CAPE readings have consistently preceded below-average 10-year returns, even when the short-run direction remains positive.
| Valuation measure | Current reading | Interpretation |
|---|---|---|
| Forward P/E (12-month) | 20.0 | Near 5-year average of 19.9; not stretched |
| 10-year CAPE | ~41.6 | Near all-time high; historically precedes thin long-run returns |
| 30-year Treasury yield | 5.337% (August high) | Near 20-year high; compresses equity risk premium |
| Equity risk premium | Historically narrow | Bonds offering competition to equities not seen since 2007 |
| Top 10 stocks as % of index | ~39% | Concentration at historical extremes |
The Bond Market Signal That Overrides Everything Else in the Near Term
The relationship between the S&P 500 and long-end Treasury yields is the most important single signal in the current market, and it has been operative throughout the August pullback. When the 30-year yield pushed above 5.3% in mid-August, equities sold off. When yields eased, the index recovered. The correlation has been that direct.
The mechanism is the equity risk premium, the excess return investors demand for holding equities over risk-free government bonds. When 30-year Treasuries yield 5.3%, the hurdle rate for equities rises correspondingly. An index with a forward earnings yield of 5% (the inverse of the 20x P/E) offers no premium over risk-free bonds at that yield level. Investors can buy guaranteed 5.3% returns from the US government or uncertain equity returns that historically average more but start at a lower initial yield. That arithmetic has historically led to either equity multiple compression, bond yield declines, or both.
The September FOMC meeting on September 15-16 is the most consequential scheduled event for the remainder of 2026. The Fed's updated economic projections at this meeting will signal whether rate cuts are approaching, which would relieve the pressure from elevated short-end yields. Long-end yields are less directly controlled by Fed policy, but the signal from a rate-cutting Fed reduces long-end yields indirectly by improving the growth and inflation outlook, reducing the term premium that investors demand for holding long-duration bonds. A clear rate cut signal from September's FOMC would address both the short-end rate level and the signal that drives long-end yields, which would be the most direct relief for the equity multiple compression that elevated bond yields are currently imposing.
The Wall Street Forecast Landscape
The range of published year-end 2026 targets from major financial institutions spans from 7,100 to 8,400, with the densest cluster at 8,000 to 8,100. The median across the 16 published targets sits at 8,000, implying approximately 4% upside from the August pullback level of roughly 7,680.
The disagreement between bulls and bears at the institutional level is not primarily about the multiple. It is about the earnings trajectory beyond 2026. J.P. Morgan builds its 8,000 target on 2026 earnings of $365 per share, above the consensus of $358. Barclays arrives at 7,800 using a $337 earnings assumption and a reduced technology sector multiple of 26x, cut from 27.5x. Bank of America maintains a 7,100 target based on the observation that the index is expensive on 18 of 20 valuation measures the bank tracks, a fundamental disagreement about whether current earnings justify current valuation rather than a model calibration difference.
The revision trend is itself informative. Most of these targets have been raised through 2026: Goldman Sachs from 7,600 to 8,000, J.P. Morgan from 7,800 to 8,000 (twice in two months), Citigroup from 7,700 to 8,100. Strategist revision momentum, where targets are being raised rather than cut, has historically been a better near-term directional signal than the absolute level of any single target. The current revision trend is upward, which aligns with the bull case.
The Near-Term Calendar: Specific Dates That Move the Index
The remainder of 2026 contains a concentrated set of scheduled macro events, each capable of moving the index several percentage points in a single session.
The August employment report on September 4 provides the first post-summer read on labour market conditions. A weak print supports the Fed rate cut case but simultaneously raises growth concerns. A strong print reduces immediate pressure for rate cuts but confirms that the economy is not in a recession, which is a mixed signal for the equity multiple compression dynamic.
August CPI on September 11 is the inflation reading that the Fed will have in hand when it meets September 15-16. If core inflation has fallen toward the 2% target, the rate cut case strengthens. If it is sticky above 3%, the higher-for-longer scenario extends.
The September 15-16 FOMC meeting carries the most weight of any single event for the remainder of the year, with updated economic projections that will signal the Fed's rate path through year-end and into 2027.
The quarterly index rebalance and futures expiry on September 18 creates concentrated mechanical flows unrelated to fundamental valuation. Traders describe this as a session with elevated volume and short-lived dislocations rather than directional trend.
Third-quarter earnings season opens in October with the large banks, providing the first full read on whether the 2027 earnings estimates are holding or being revised down.
November's US midterm elections reprice tax and spending expectations depending on Congressional control outcomes.
The September Squeeze: Why the Month Is Elevated Risk
September is historically the worst calendar month for the S&P 500 by average return. The combination of the August employment report, August CPI, the most consequential FOMC meeting of the year, and the quarterly rebalance all landing within the same five-trading-day window creates a uniquely concentrated risk period.
A trader holding an S&P 500 CFD long through September 11 to 18 is exposed to four potential major volatility events in sequence. Each one can move the index multiple percentage points. The directional outcome of each event is genuinely uncertain before it occurs. This is not an argument against holding a position through September, but it is an argument for sizing the position to survive adverse outcomes from multiple events rather than treating any single forecast as reliable.
The 7,380 level, the 100-day moving average, is the technical threshold that most strategists identify as the line that separates a normal September pullback from something more concerning. A sustained close below 7,380 would bring the July lows near 7,237 back into play and change the trend classification for the remainder of 2026. Fairlead Strategies' Katie Stockton has specifically identified 7,620, the 50-day moving average area, as the level where consecutive closes below would call the August breakout into question.
The AI Capex Reckoning: What 2027 Bears Are Watching
The bear case for the S&P 500 beyond 2026 does not rest on imminent recession or immediate earnings collapse. It rests on a specific and datable accounting dynamic: the capital expenditure cycle in artificial intelligence.
The five largest cloud operators are on track to spend far more on AI infrastructure in 2025 and 2026 than they are booking in depreciation charges against existing infrastructure. Depreciation follows economic asset life, which for data centre equipment and networking infrastructure runs five to ten years. The spending is happening now; the full depreciation charge against earnings arrives over multiple years. When the pace of new capital expenditure slows, as it eventually must when infrastructure build-out reaches saturation, the depreciation on prior spending continues without the revenue growth that new infrastructure investment supports. The first year where depreciation exceeds new revenue contributions from AI investment is when the earnings reckoning for the technology sector begins.
Analysts who have studied the depreciation timing place this inflection point in 2027, which is when the 13.6% earnings growth estimate that currently looks conservative relative to 2026's 30% could prove optimistic. This is the most specific and datable risk in the medium-term S&P 500 outlook, and it is the reason why bears who are not calling for a crash in 2026 are nevertheless cautious about 2027 earnings assumptions.
What the Base Case Actually Looks Like
The base case for the remainder of 2026, derived from the current technical structure and the macro calendar, is a range of 7,450 to 8,250 with a year-end average near 7,900. That sits slightly below the median Wall Street target of 8,000, reflecting more weight on the long-end yield drag than the typical strategist assigns.
The path through September is the most uncertain part. The concentrated macro calendar between September 4 and September 18 creates a window where the index could test the 7,380 support level or break above the 7,816 record with roughly equal probability depending on whether the FOMC is dovish or hawkish. Both outcomes are plausible given the current data.
Beyond September, the October earnings season provides the fundamental anchor for year-end positioning. If Q3 earnings confirm that the 2027 estimate of 13.6% growth is intact, the bull case for 7,900 to 8,000 at year-end is well-supported. If Q3 earnings produce guidance revisions that cast doubt on 2027 estimates, the bear case for 7,100 to 7,400 becomes more credible.
The November midterm elections represent a political macro variable that is difficult to model but could be large in its market impact depending on the tax and tariff implications of different Congressional outcomes. Market participants generally prefer legislative gridlock as a neutral macro outcome; significant shifts in tax policy in either direction tend to produce short-term volatility.
Conclusion
The S&P 500 in the second half of 2026 sits at the intersection of the strongest earnings growth since 2021 and the highest long-end bond yields since before the financial crisis. The earnings engine argues for higher prices; the bond market argues for multiple compression that limits how high. The September macro calendar, specifically the FOMC meeting and the surrounding data releases, will determine which force is winning. A dovish Fed signal would relieve the bond market pressure and support the 7,900 to 8,000 year-end base case. A hawkish signal or sticky inflation would extend the pressure and push the index toward the lower end of the 7,450 to 8,250 range. Beyond 2026, the AI capex depreciation reckoning that analysts project for 2027 is the most specific datable risk in the medium-term outlook, and it is the reason why the 5% annual compounding assumption through 2030 is set deliberately below the index's historical average rather than at it.


Top Comments
Disclaimer & comment rulesCommenting for this story is now closed.
If you have a Facebook account, become a fan and comment on our Facebook Page!