MercoPress. South Atlantic News Agency
Falklands economy boasts healthy trade surplus but income inequality increases
 The report warns that ‘for an economy to rely on few export commodities also means being vulnerable to world market prices.’
 The value of goods exported from the Falkland Islands recorded a compound annual growth rate of 8.1% between 2010 and 2019, according to the Falkland Islands Government’s State of the Economy report.
Exports for 2019 totalled £234m, thereby comfortably exceeding the value of imports for the same year (£73.1m). The islands have recorded positive trade balances every year between 2009 and 2018 except for 2011 and 2015 when imports associated with oil exploration resulted in a negative trade balance.
The report notes that ‘large trade surpluses have ensured a high level of well being and solid fiscal revenues’ in recent years, but warns that ‘for an economy to rely on few export commodities also means being vulnerable to world market prices.’
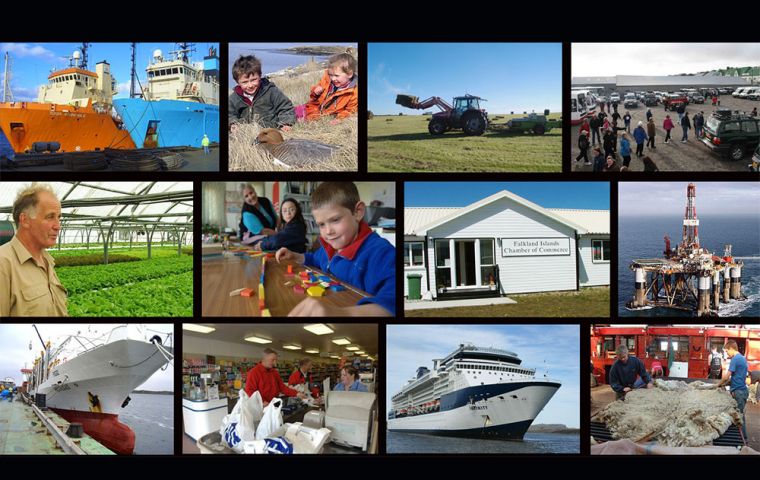
Fishery products accounted for 91% of all exports between 2010 and 2019, (£144m per year) wool 5.5% (£8.3m per year), and meat 1.2% (£1.9m per year).
Income inequality up
The after-tax Gini coefficient, a statistical measure used to represent income inequality has increased from a three year average of 0.34 in 2005-07 to 0.37 in 2017-19, the report found. The Gini figure can be anywhere between 0 and 1, with 0 being total equality and 1 being the maximum possible inequality. An after-tax Gini of 0.37 places the Falklands as having a high level of inequality, above the UK’s 0.34 but below the US’s 0.40.
However, the report argues that the figure may be down to the Islands’ benign income tax regime, and notes that the islands’ pre-tax Gini coefficient (0.41, 2017-19 three year average) is much lower than that of countries with a similar after-tax Gini figure.
As to the causes of the rise in inequality, the report points towards the impacts of the global financial crisis between 2008 and 2012 and to a rise in dividends, the income from which increased at a faster rate than other sources of income.
When adjusted for population growth and inflation, the three year average for dividend income increased by 250% between 2005-7 and 2016-8, compared to a 53% increase in the same period for property and investment income, and drops of 3% and 4% in wages and pension incomes respectively. This rise in dividends may in turn be explained by the increase of the fishing sector’s gross value added (GVA) over the same period, the report argues. Conversely, a rise in the income recorded by the bottom 50% earners, possibly due to higher tourism income, may have reduced income inequality between 2012 and 2015, but this was offset by dividend increases in the 2016-8 period.
Real GDP up 14.6% between 2007 and 2018
The Falkland Islands’ real GDP increased by 14.6% between 2007 and 2018, equivalent to a compound annual growth rate of 1.2%, according to the report.
The islands’ nominal GDP, however, increased by 140% (8.3% compound annual growth rate) in the same period. Nominal GDP, the report notes, reflects ‘changes in the volume of goods and services produced and changes in the prices of those goods and services, whereas the real GDP ‘only reflects changes in the volume of goods and services produced rather than changes in prices too.’
The report goes on to say: ‘Both measures are equally important and must be considered in a complementary manner: it is probably wiser to look at nominal GDP when assessing the contribution to the economic well-being of our export-oriented sectors, while looking at real GDP when assessing the healthy growth of our non-resource sectors over time.’
In explaining the low growth rate in real GDP, the paper notes that the fishing sector did not show significant growth in real terms between 2007 and 2018. However, the islands’ non-resource GDP (the GDP figure excluding the fishing and hydrocarbon exploration sectors) increased at a compounded average growth rate of 3% per year between 2009 and 2018.
The fishing and aquaculture sector was the largest contributor to the islands’ GDP, accounting for 63.6% of the figure, while the next largest sector comprised retail, transportation, storage, accommodation and food service activities representing 7.8% of the GDP figure.
While Tourism is not considered a stand-alone industry for GDP purposes, the Falkland Island Tourist Board calculates that Tourism’s gross value added in 2018 was £5.5m, which would be equivalent to 2.2% of the islands’ GDP (6.5% of non-resource GDP).
Crop and animal production accounted for 2.7% of the GDP.


Top Comments
Disclaimer & comment rules-

-

-

Read all commentsDear MercoPress editor,
May 07th, 2021 - 01:20 pm 0Please kindly give a verbal lashing to the author of this outrageously useless article.
It also might be helpful to threaten violence against any of your esteemed writers should they too start quoting Gini coefficients which is highly detrimental to the prestige of this esteemed news site.
Sincerely, Chicureo
inequality is a direct result of fig policy to make the minority rich (fisheries lottery winners) richer and stronger. taxes could be adjusted to redistribute more of the wealth if fig has the courage to recognize reform is needed.
May 08th, 2021 - 03:22 pm 0Mr. Portman...
May 08th, 2021 - 04:45 pm 0May I ask why you call them windblown Isles carefully predetermined, congenic (almost consogenic) original distribution of fishing rights and licences for a ***“Lottery”***...?
IMHO, a lottery has equal elements of randomness, chance & luck...
Elements I don't recall having being present in that 80'es “distribution”...
Capisce...?
Commenting for this story is now closed.
If you have a Facebook account, become a fan and comment on our Facebook Page!