MercoPress. South Atlantic News Agency
Tag: Sugar Price Index
-
Thursday, August 15th 2019 - 12:15 UTC
Global food commodity prices saw a slight decline in July

The FAO's Food Price Index, (FPI) - a trade-weighted index that measures prices of five major food commodities on international markets - averaged 170.9 points in July 2019, slipping 1.1 percent below its level in June but up 2.3 percent from a year earlier.
-
Friday, December 13th 2013 - 08:52 UTC
FAO food price index in November unchanged: dairy up 23% over a year ago

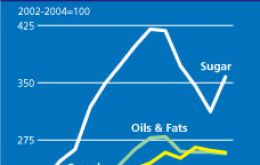
The FAO Food Price Index averaged 206.3 points in November 2013, almost unchanged from the revised value of 206.6 points in October, but 9.5 points (4.4%) below its November 2012 value. A sharp decline in sugar prices last month nearly offset the rise in oils. Cereals averaged slightly lower but meat and dairy values were stable.
-
Monday, March 19th 2012 - 15:44 UTC
FAO Food price index rose 1% in February but is 10% below a year ago

The FAO Food Price Index rose 1% or 2.4 points from January to February. The Index climbed nearly 2% in January – its first increase in six months. The February increase was mostly driven by higher prices of sugar, oils and cereals while dairy prices fell slightly after a marked rise in January.
-
Monday, July 11th 2011 - 18:17 UTC
“Sweet” sugar futures until the northern hemisphere crop is harvested

Sugar supplies will remain limited until the 2012-13 harvest begins in top producer Brazil, broker FCStone do Brasil said citing futures traded in New York. The rise in sugar price helped push the FAO Food Price Index to 234 points in June, which is 39% higher than a year ago.
-
Thursday, July 7th 2011 - 16:24 UTC
“Sweet” sugar hikes FAO Food Price Index in June to 39% above a year ago

United Nations Food and Agriculture Organization, FAO, Food Price Index rose one percent to 234 points in June 2011 – 39% higher than in June 2010 but four percent below its all-time high of 238 points in February of this year.
-
Thursday, March 3rd 2011 - 18:50 UTC
Food prices increase in February for eighth consecutive month, says FAO report

Global food prices increased for the eighth consecutive month in February, with prices of all commodity groups monitored rising again, except for sugar, FAO said on Thursday. FAO expects a tightening of the global cereal supply and demand balance in 2010/11
